Navigating Grafana with Loki
Simple Logs Dashboard
Menu (top-left) -> Dashboards -> Simple Logs Dashboard
Set your time range and refresh rate in the top-right corner
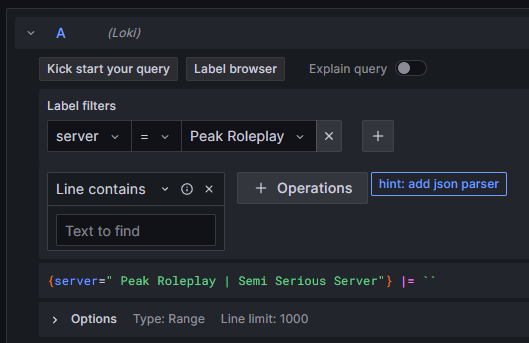
Live Logs with filtering
Menu (top-left) -> Explore
Set label filters using dropdowns
Example... Select label = server Select value = Your Server Name Click 'Run Query' in the top-right corner
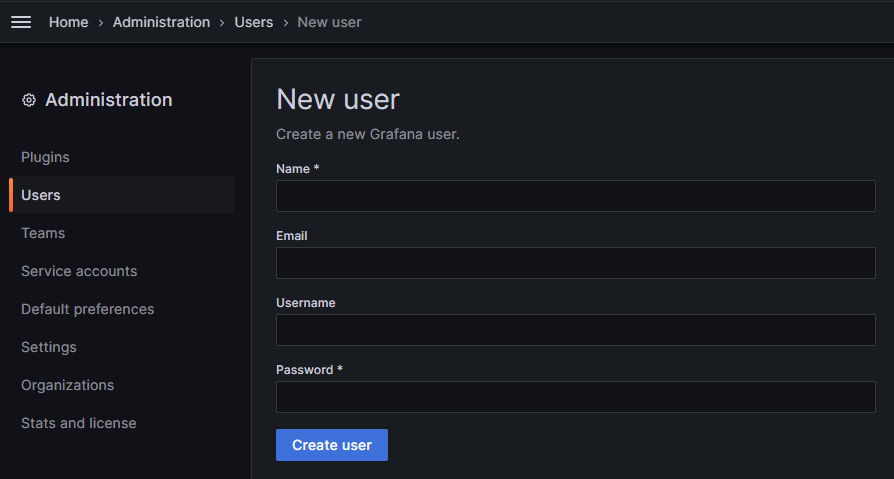
Create New Grafana Users
Menu (top-left) -> Administration -> Users -> New User
Once the user has been created, click on their account on the Users page and edit their permissions as needed